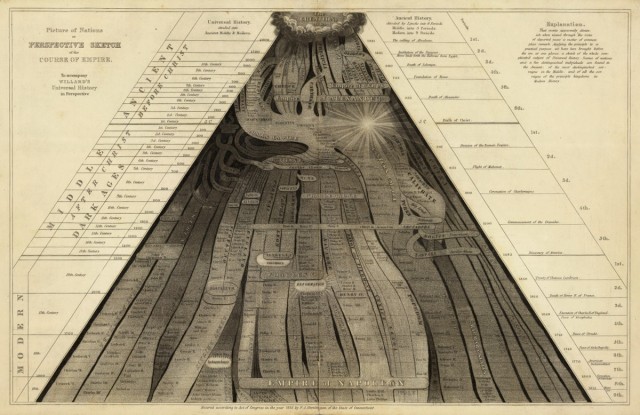
When Willard began publishing textbooks in the 1820s, she knew the competition was fierce, full of sharp-elbowed authors who routinely accused one another of plagiarizing ideas and text. To build her brand, she designed cutting-edge graphics that would differentiate her work and catch the attention of the young. Take, for instance, her “Perspective Sketch of the Course of Empire” of 1835.

By the nineteenth century, timelines had become relatively common, an innovation of the eighteenth century designed to feed growing public interest in ancient as well as modern history. First developed by Jacques Barbeu-Dubourg in the 1750s, early timelines generally charted the lives of individuals on a chronological grid, reflecting the Enlightenment assumption that history could be measured against an absolute scale of time, moving inexorably onward from zero. In 1765, Joseph Priestley drew from calendars, chronologies, and geographies to plot the lives of two thousand men between 1200 BC and 1750 AD in his popular Chart of Biography.
After Priestley, timelines flourished, but they generally lacked any sense of the dimensionality of time, representing the past as a uniform march from left to right. By contrast, Emma Willard sought to invest chronology with a sense of perspective, presenting the biblical Creation as the apex of a triangle that then flowed forward in time and space toward the viewer. Commenting on her visual framework in 1835, Willard noted that individuals experience the past relative to their own lives, for “events apparently diminish when viewed through the vista of departed years.” In “Perspective Sketch of the Course of Empire”, she found striking ways to represent this dimensionality of time. The birth of Christ, for example, is marked with a bright light, marking the end of the first third of human history. The discovery of America separated the second (middle) from the third (modern) stage. Each “civilization” is situated not according to its geography, as on a traditional map, but according to its connection and relation to other civilizations. Some of these societies are permeable, flowing into others, while others, such as China, are firmly demarcated to denote their isolation. By studying this map, students were encouraged to see human history as a rise and fall of civilizations — an “ancestry of nations”.

Moreover, as time flows forward the stream widens, demonstrating that history became more relevant as it unfolds and approaches the student’s own life. Historical time is not uniform but dimensional. On the one hand, this reflected her sense that time itself had accelerated through the advent of steam and rail. Traditional timelines, she found, were only partially capable of representing change in an era of rapid technological progress. Time was not absolute, but relative. On the other hand, Willard’s approach reflected her own deep nationalism, for it asked students to recognize the emergence of the United States as the culmination of human history and progress.


